Statistic & Probability
A statistic is a quantity calculated from a sample.
The probability of an event \(E\) is:
\[P(E) \in \left[0,1\right] \]
- Probability of \(0\) means no chance of happening
- Probability of \(1\) means guarenteed to happen
 Monte Carlo Coin Flip
Flips: 0
Monte Carlo Coin Flip,
Normalized
Flips: 0
Statistics
Probability
|
Theoretical: P(H) = 0.5 P(T) = 0.5 |
🎲 Monte Carlo Die Roll
Rolls: 0
🎲 Monte Carlo Die Roll, Normalized
Rolls: 0
The Cat Machine has a random probability of generating a cat.
Try the machine and then guess \(P(\text{cat})\)!
Try the machine and then guess \(P(\text{cat})\)!
→
Create a 6x6 grid with both the rows and columns labeled 1 through 6.
- In each cell, write the sum of the row and column. For example, row2-col5 should have a 7 in it.
- How many unique sums are possible?
- How many times does each sum appear in the grid? Make a normalized histogram.
- Experimentally collect as much data as you can by rolling two dice and recording their sum. Create a histogram of your data and compare it to the theoretical distribution.
- Determine a function to fit the distribution from your experimental data.
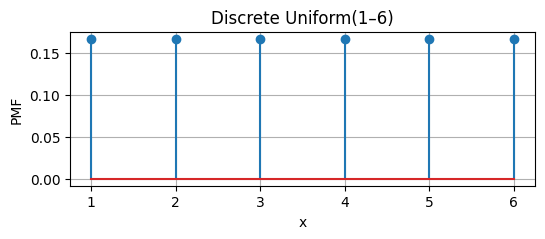
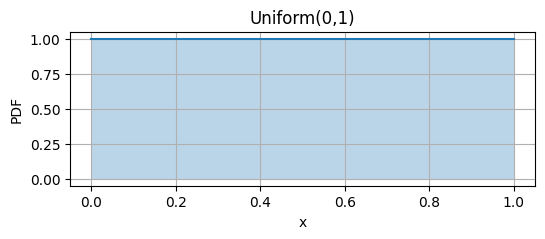
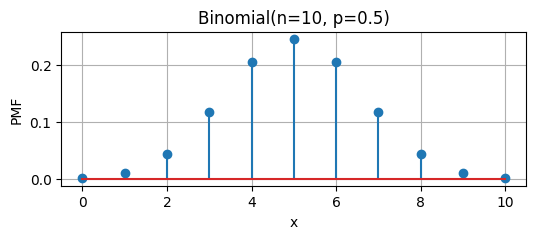
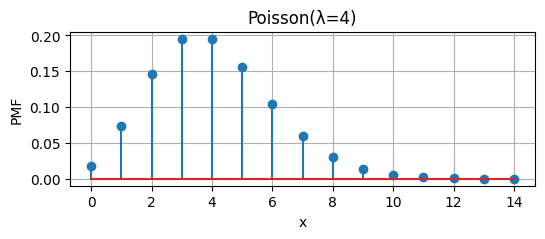
Discrete v. Continuous
| Discrete | Continuous |
|---|---|
 Flipping a coin Flipping a coin |
 Time a trip takes Time a trip takes |
 Rolling a die Rolling a die |
 Length of a broken stick Length of a broken stick |
 Drawing a card Drawing a card |
 Temperature on Dec 19 Temperature on Dec 19 |
 Choosing a person Choosing a person |
 Height of a person Height of a person |
| Discrete | Continuous |
 |
 |
 |
 |
 |
 |
Probability of rolling an even number = \(\frac{1}{6}+\frac{1}{6}+\frac{1}{6}\)
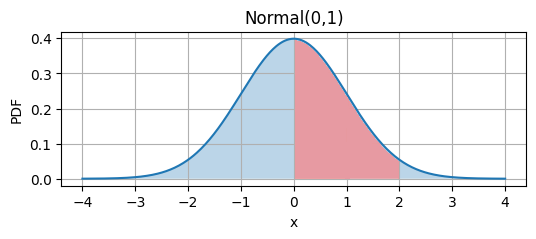
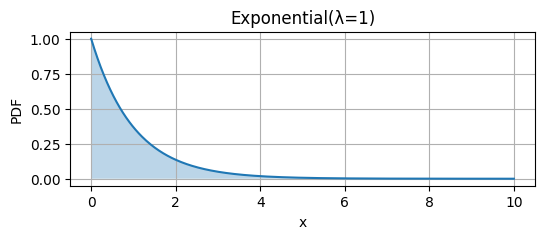
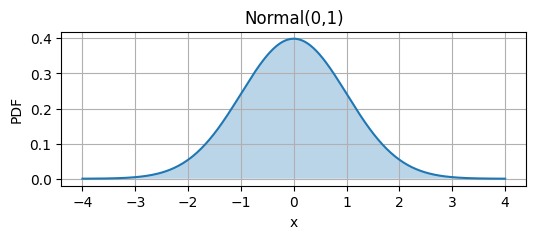
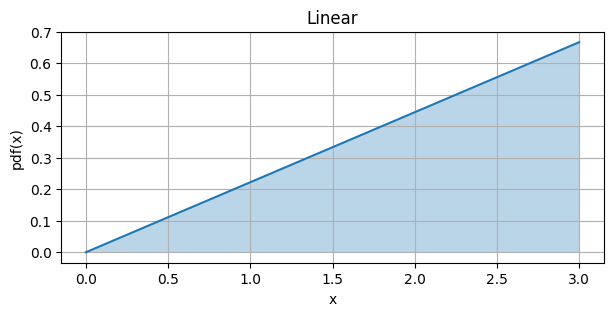
Probability of value between 0 and 2 = \[ \int_{0}^{2} f(x) \ dx \]
Probability of value between 1 and 2 =
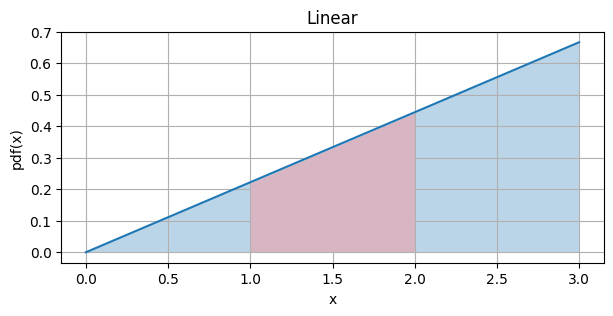
Probability of value between 1 and 2 = \[ \int_{1}^{2} f(x) \ dx = \]
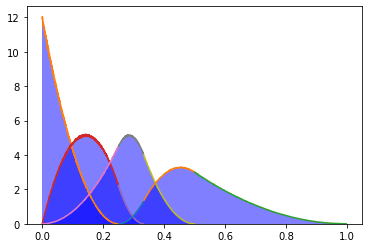
Broken Stick Problem
Given a stick broken at two random places, what is the probability that the three pieces can form a triangle?
©2025 Jedediyah Williams
This work is licensed under the Creative Commons
Attribution-NonCommercial-ShareAlike 4.0
International License.

To view a copy of this license, visit https://creativecommons.org/licenses/by-nc-sa/4.0/.