Write your solutions into a Google Colab. Be sure to number your solutions with text cells or Python comments. - Write the following arithmetic expressions and print the results:
- \(\quad5 + 18\)
- \(\quad \sqrt{3^2+4^2}\)
- \(\quad\frac{10+16}{5-3}\)
- \(\quad \frac{\sqrt{2}}{2}\)
- \(\quad\frac{32}{7}\)
- \(\quad \frac{\sqrt{3}-\frac{1}{2}}{3+\sqrt{5}}\)
- \(\quad\frac{4}{5} \times 8\)
- \(\quad \sqrt{5+\sqrt{3}}\)
- \(\quad\frac{3+5 \times 7}{6}\)
- \(\quad \frac{\sin^{2}\left(\frac{1}{2}\right)}{1-\cos\left(\frac{1}{2}\right)}\)
- \(\quad\frac{12-7}{4+8}\)
- \(\quad \frac{\frac{3}{4}+2}{1+2}\)
- In separate code cells, write a script that:
- Creates a variable \(x\) and assigns it the value 0.05
- Assigns \(x\) the updated value of: \(3x(1-x)\)
Run the cell containing only part b several times until it "converges". - Plot the following data in three different ways:
| X | Y |
|---|
| 2 | 4.6 |
| 3 | 3.3 |
| 5 | 2.7 |
| 7 | 3.5 |
| 8 | 4.9 |
| 10 | 5.8 |
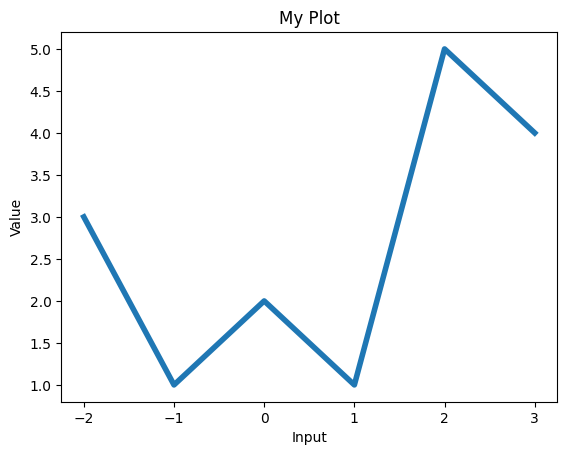
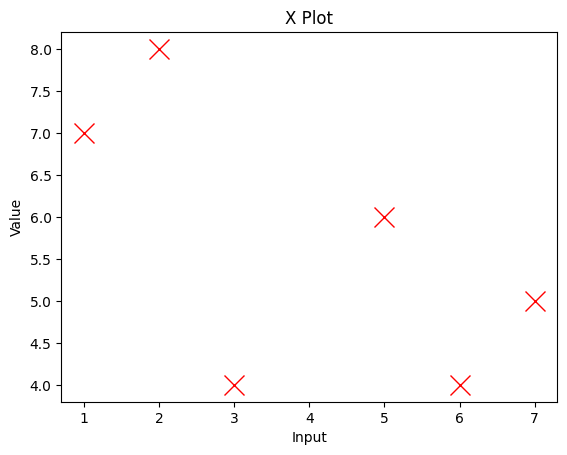
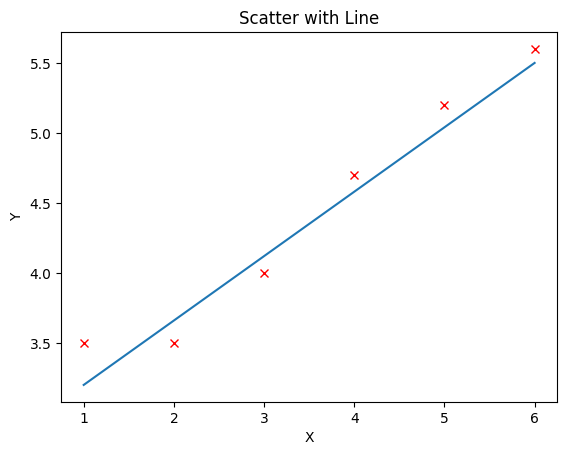
- Re-create the plots below. It will be helpful to familiarize with the Matplotlib documentation, including the Pyplot tutorial and perhaps the markers_api.